COMPATIBILITY
Some of the compatibility features in Sirius are:
- BiWheels and Compatibility Aspect Grids
- Midpoint Trees Between Two Charts
- Composite Charts
- Compatibility Scores
- Vedic Marriage Making
- Compatibility Interpretations
- Compatibility Research
- Each of these areas of compatibility is described below.
*You can click on the images below to see a larger version of the image.
 BIWHEELS AND COMPATIBILITY ASPECT GRIDS
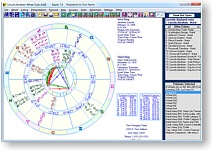
There are several BiWheel styles. The traditional BiWheel with the house cusps of the inner wheel going through the outer wheel is a popular one. The BiWheel with each ring having its own cusps appears to be getting more popular. You can also include a small aspect grid with the BiWheel or a larger aspect grid by itself.
Because you can easily select a BiWheel between any two charts, astrologers who use harmonic astrology, for example, can easily create a BiWheel of two harmonic charts. If you are interested in how a BiWheel of harmonic charts can be interpreted, you might enjoy watching the tutorial video on Compatibility Using Harmonic Astrology; this video focuses mostly on interpreting a BiWheel of two harmonic charts.
You can also select a Harmonic Aspect Grid, which is a table of harmonic aspects between two charts. You can specify the largest harmonic and the orb of the first harmonic and the orb of other harmonics is proportionate to the orb for the first harmonic.

MIDPOINT TREES BETWEEN TWO CHARTS
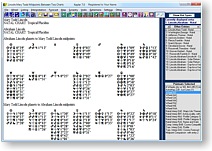 Astrologers who use midpoints extensively are likely to find the midpoint trees between two charts very useful. These midpoint trees show midpoint structures formed between planets in one chart and the midpoints in the other chart.
By the way, if you select midpoint trees of a chart of current transits and a natal chart, you can select the Time Adjust feature to see the midpoints change over time. The time line format typically is more convenient for seeing transit-to-natal, progressed-to-natal, and progressed-to-progressed midpoint structures but using the Time Adjust feature while viewing midpoint trees between two charts can also be a useful tool.
COMPOSITE CHARTS
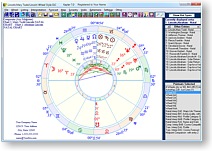 Many astrologers consider composite charts to be important. There are several variations of composite charts that affect how the house cusps are calculated. Kepler allows you to choose Asc Midpoint, MC Midpoint, and Derived Latitude. You can also select the Davison Time-Space composite chart. Another variation of the composite chart known as the Coalescent Chart is also available. You can also calculate a composite chart of more than two charts; a maximum of 20 charts can be combined together in a composite chart.
Many astrologers are familiar with a composite chart calculated using Derived Latitude and not using Derived Latitude but the distinction between Asc Midpoint and MC Midpoint may not be clear. All of these methods of calculating composite house cusps are ways to ensure that the 12 house cusps appear in proper order rather than jumping around the zodiac in a way that would make it impossible to put houses in the composite chart. The Asc Midpoint and MC Midpoint composite charts ensure that the house cusps are in proper order by flipping the houses 180 degrees if necessary. The Asc Midpoint method will flip the MC if necessary and never flip the Asc while the MC Midpoint method will flip the Asc if necessary and never flip the MC.
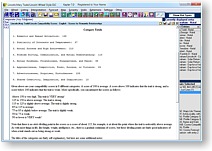
COMPATIBILITY SCORES
COMPATIBILITY INTERPRETATIONS
The Cosmo Compatibility Report is included in Kepler and it is available in these languages: English, Spanish, French, German, and Norwegian. The reports can be produced with or without graphic images. The Cosmo Compatibility Report compares the Sun signs, compare the Moon signs, and major aspects between the charts. The interpretations are clear, brief, and have received excellent reviews for quality.
Click for PDF samples:
– English
– Spanish
– French
– German
– Norwegian
COMPATIBILITY RESEARCH AND MATCH MAKING
Suppose that you have a database of husbands and wives who are happily married and you would like to do research to see what astrological influences are in the chart comparisons of these couples. The Pairs Research feature allows you to do this.
You can also do match-making by having one group of people with a particular classification and another group of people with a different classification and you can produce a list of best matches. For example, suppose that you have 100 charts of men seeking women and 100 charts of women seeking men.
You can enter the data of the men and assign them a My Category that you could call Men Seeking Women and do the same thing for the women and put them in a different My Category that you call Women Seeking Men. Then you can produce a list of matches between the groups sorted with the highest scores at the top of the list.
You can create the AstroSignature that you use as the basis for the scores. Note that this analysis can take a very long time due to what mathematicians call combinatorial explosion.
There are 10,000 possible combinations (100 x 100) between these two groups! Even a computer will take a long time to do 10,000 comparisons!
