
 BEAUTIFULLY ORGANISED SO YOU CAN WORK EFFORTLESSLY!
VIDEO 5:50

Blue Icons:
Make a new chart. A progression, solar return, composite chart, relocated chart, and harmonic chart, for example, give you a new set of planetary positions. Make new charts with the blue icons.
Click on image for full details
Green Icons:
Select chart wheels, interpretations, listings. Here you select whatever information you want about this chart, whether it is a wheel, interpretation, table, listing, etc.
Click on image for full details
DO COMPLEX THINGS VERY EASILY!
Now Select Midpoint Structures Between the Solar Return and the Natal Chart!
Sound difficult? It’s easy. Just select a Solar Return chart and then select the midpoints between the charts. A Solar Return is a new chart; it has new planetary positions, so we select it with a blue icon. When we put the cursor on the blue icon with the letter “R” on it, we see that this is for returns. Then we move our cursor of the icon with “Syn” on it and it tells us that this is for Synastry and we select Midpoints. Done!
How about something “crazy” like a harmonic chart of a composite chart? Easy! Just select the composite chart. Then select the harmonic chart of this composite chart.
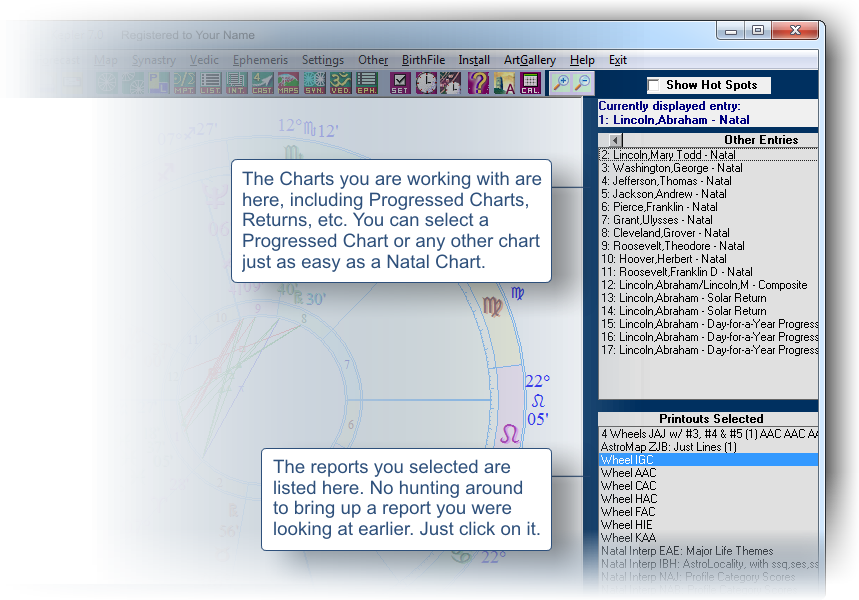
ALL OF YOUR CHART ENTRIES LISTED AND REPORTS SELECTED ARE EASILY AVAILABLE!
Many astrologers look at many charts and reports. You may wish to see an AstroMap, and then a forecast, a progressed chart, a composite chart, and then you may wish to see the same AstroMap for another person, etc. In Kepler you quickly jump to the information you want with a few mouse clicks.
Click on image for full details
YOU NOW KNOW THE BASIC IDEA OF HOW KEPLER WORKS.
From that short description and a few screen captures, you now understand how Kepler works. Kepler and Pegasus work the same way. The details of how to use the program are usually obvious just by looking at what is on your screen. The Help system is very comprehensive and we have tutorial videos as well. If something seems to not be correct or you feel stuck somewhere, we also provide outstanding customer support.
There are so many exciting features in Kepler and we have described just the basic layout of the program here. See the other sections that describe the data entry screen and the interactive customising capabilities if you wish to learn more.